🏠 Dashboard Overview
The Dashboard is your starting point and financial command centre in Moneytor. It’s designed to give you a clear and immediate overview of your entire financial landscape. By bringing together key insights from all your accounts and transactions, the dashboard helps you understand your financial health at a glance.
Controlling Your Timeframe
At the top of the dashboard, you’ll find tabs that allow you to change the timeframe for all the data you see. This is designed to give you a quick yet powerful way to view your finances. The available options are:
- Month
- Quarter
- Six Months
- Calendar Year
- Financial Year
Simply click on a tab, and the entire dashboard—from your net worth to your spending—will instantly update to reflect the data for that selected period.
Important Note on Dates: All time periods are calculated backwards from the date of your last available transaction. For example, if your most recent transaction is from January 15th, 2025, selecting the “Month” tab will show you data for January, even if today’s date is in July. This ensures your dashboard always provides an accurate overview of the period where you have actual data.
Income and Spending Widgets
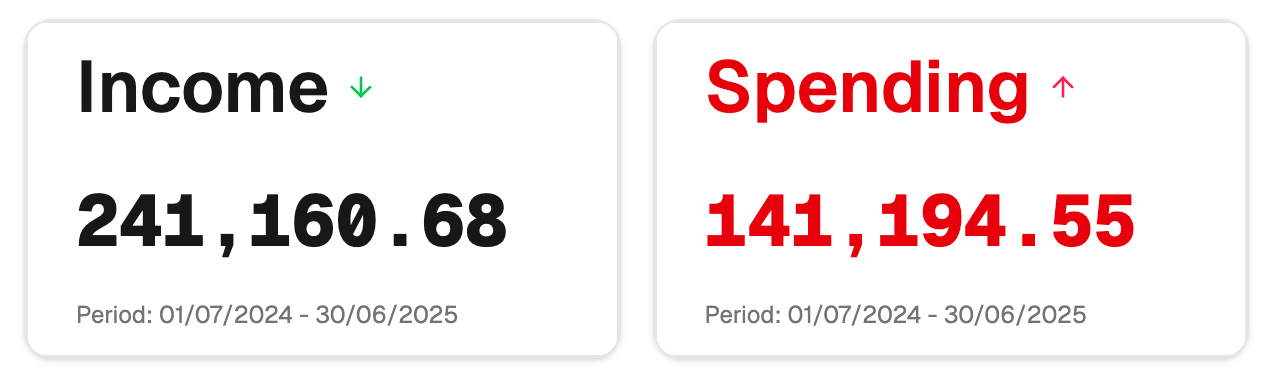
The income and spending widgets provide an overview of your cash flow based on the timeframe you’ve selected. They show your total income, total expenses, and how your spending breaks down across different categories. These widgets are designed to give you a quick glance at your financial performance and help you understand exactly where your money is going.
Income vs Expense Trend
What it shows: This widget provides a direct visual comparison of your total income versus your total expenses for the selected timeframe. It’s the easiest way to see if you are earning more than you’re spending and how that trend develops over time.
How it works: The chart intelligently adapts to the timeframe you’ve chosen:
- When you select the Month view, it typically displays a Bar Chart, showing your total income and expense bars side-by-side for a clear monthly snapshot.
- For longer periods like Quarter or Year, it will show a Line Chart, illustrating the trend of your income and expenses over that period.
You can also manually change the format to suit your needs. The widget gives you three display options to cycle through: a Line Chart, a Bar Chart, and a detailed Table view.
Spending & Income Distribution (Treemaps)
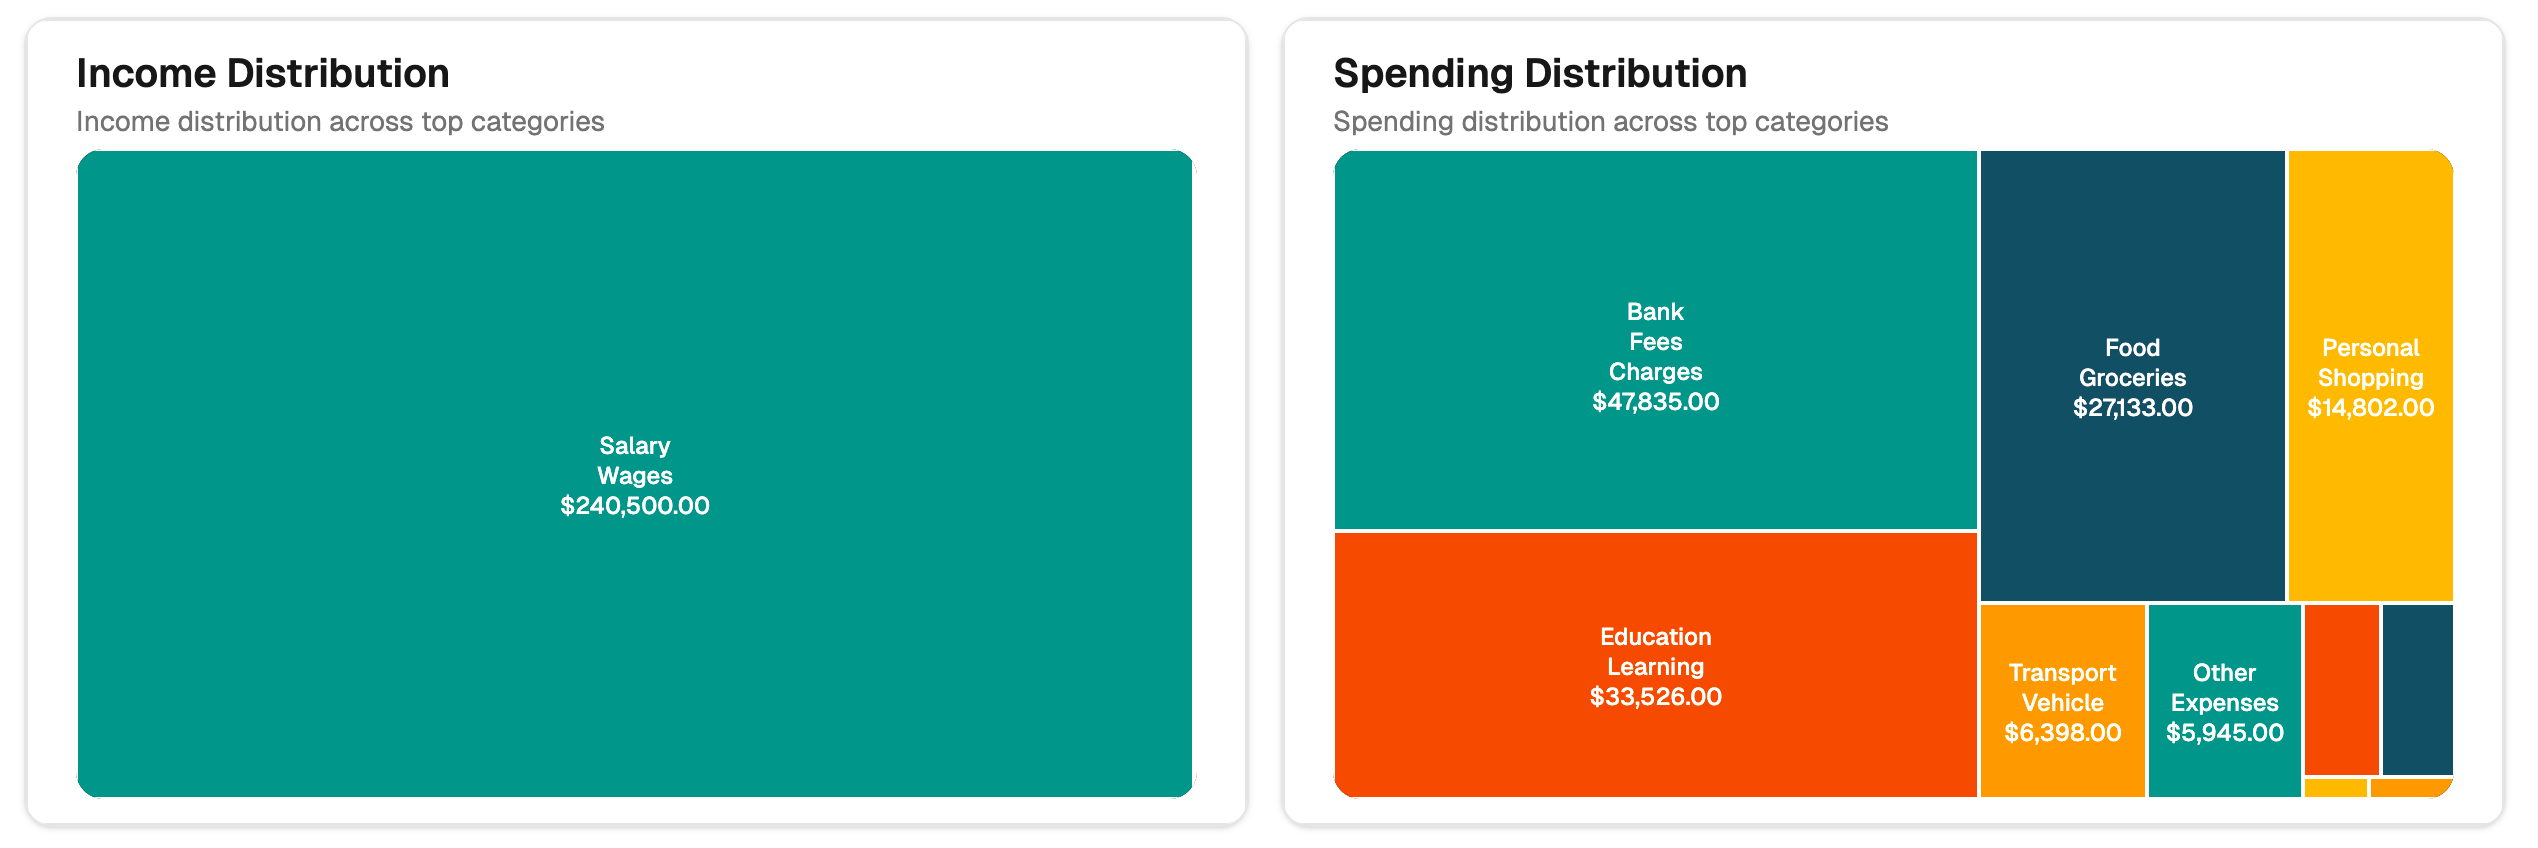
What it shows: This widget uses a treemap chart—a set of coloured rectangles—to give you a powerful visual breakdown of where your money comes from and where it goes, based on the selected time period. The larger a rectangle is, the larger the amount for that category, making it a great way to spot major trends instantly.
- Spending Treemap: Helps you identify your largest expense categories at a glance. It’s perfect for seeing where the majority of your money is being spent without digging through tables of data.
- Income Treemap: Does the same for your income, showing you which sources are contributing the most to your earnings.
Both treemaps are fully interactive, allowing you to click on a category to get more details. They update automatically whenever you change the dashboard’s timeframe.
Net Worth
Your net worth is a key indicator of your overall financial health. This section of the dashboard is dedicated to showing you how your net worth changes over time, giving you a clear picture of your progress toward your long-term financial goals.
Net Worth Trend
What it shows: This widget displays a chart showing how your net worth has progressed over the timeframe you’ve selected. It provides a quick glance at your long-term growth and includes a breakdown of your total assets (what you own) and total liabilities (what you owe).
How it’s calculated: Your net worth is calculated by taking the total balance of your asset accounts (e.g., savings, investments) and subtracting the total balance of your liability accounts (e.g., loans, credit cards). This widget tracks that final value over time so you can clearly see it grow.
Status & Tracking Widgets
Beyond the main financial overview, the dashboard includes several widgets designed to help you monitor specific items and stay organised. These widgets let you keep a close eye on the categories, groups, and transactions that matter most to you.

Tracked Categories & Groups
What it shows: This widget displays a customisable list of the spending categories and groups you have personally marked for tracking. It shows how you’re progressing in these specific areas for the selected time period, making it easy to monitor your budget for things like “Groceries,” “Fuel,” or “Subscriptions.”
How it works: You can mark any category or group for tracking on the main Categories page. Once marked, it will automatically appear in this widget for quick reference.
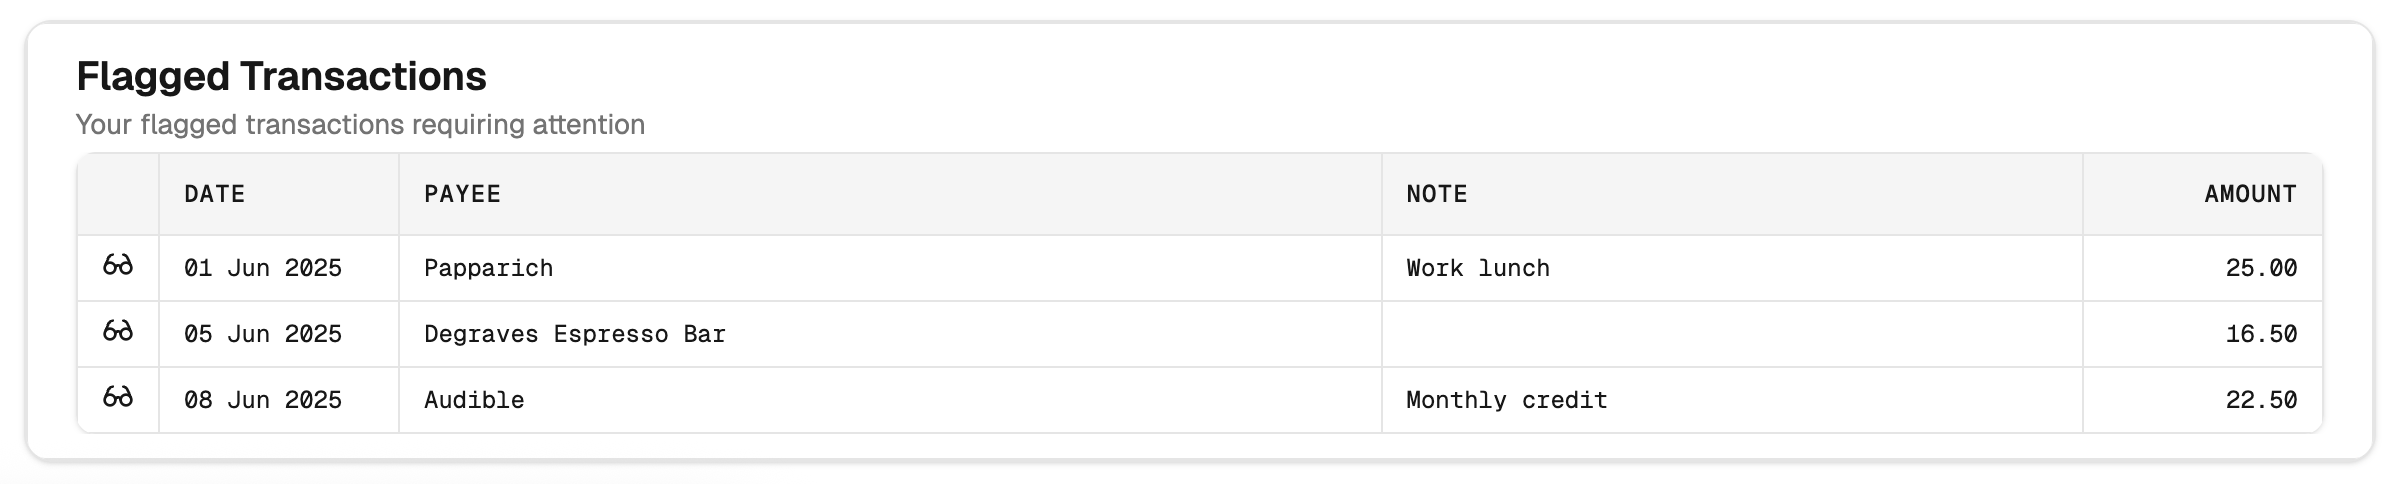
Flagged Transactions
What it shows: This widget provides a simple list of individual transactions that you have flagged. It’s the perfect place to keep track of items that need follow-up, such as a pending refund, a business expense you need to claim, or a bill you want to query.
How it works: When you flag any transaction, it appears here instantly. To remove a transaction from this list once you’ve dealt with it, you can simply click the glasses icon to unflag it.
Best Practices
To get the most out of your dashboard, here are a few tips:
- Review Regularly: Make it a habit to check your dashboard weekly. This will help you spot trends, catch potential issues early, and stay connected to your financial goals.
- Drill Down for Details: The dashboard is your summary, but the real power comes from exploring. If a number in a widget seems interesting or unusual, click on it to drill down and see the specific transactions behind it.
- Keep Things Tidy: Try to address any uncategorised transactions as they appear. Keeping your data organised ensures your dashboard is always accurate and gives you the most reliable insights.
- Use Your Trackers: Make full use of the tracking features. Flagging important transactions and tracking key budget categories will keep the information that matters most to you front and centre every time you log in.