📈 Category Analysis
Moneytor’s Category Analysis tools provide a powerful way to understand your spending and income habits in detail. This guide covers the two main parts of this feature: the Category Insights dashboard and the Detailed Category Analysis page.
Category Insights: Your Tracked Categories Dashboard
On the main Categories page in Moneytor, you have the option to “track” any category or category group that is important to your budget. Once tracked, these items will appear in a special widget on your main Dashboard for quick reference.
This Category Insights page gives you a more detailed, visual dashboard of those same tracked items, focusing on their spending trends over time.
How to Track a Category or Group
To have a category or group appear on your Insights Dashboard, you first need to mark it as “tracked.”
- Navigate to the main Categories page from the sidebar.
- Find the category or group you wish to monitor and click on it to see its management options.
- Select the Track Category option (this may be a toggle or a button).
Once enabled, the item will automatically appear on your Category Insights dashboard and in the tracking widget on your main app Dashboard.
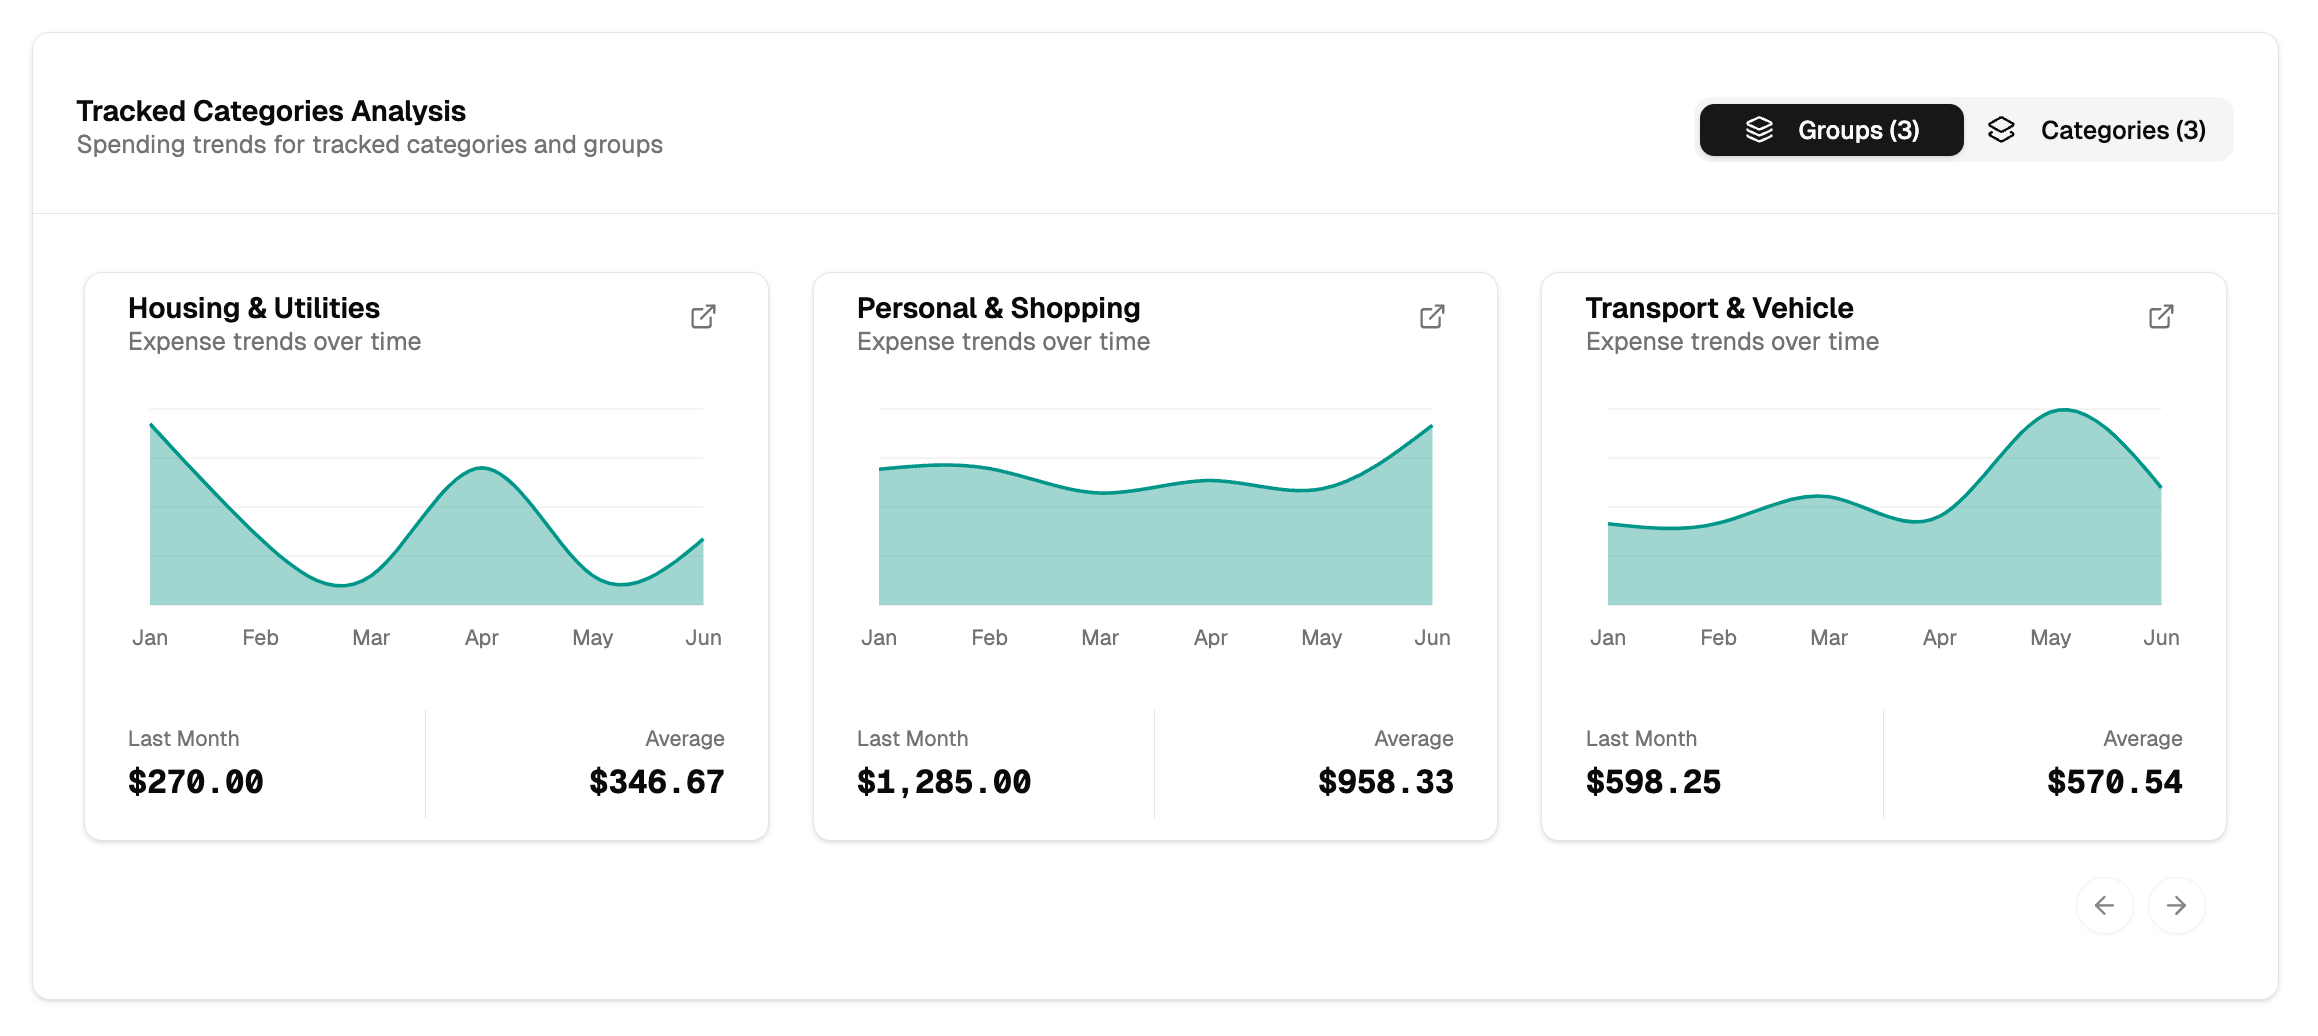
Key Features of the Insights Dashboard
- Toggle Your View: Use the “Groups” and “Categories” buttons at the top to switch between viewing your tracked category groups or your individual tracked categories.
- Trend Cards: The dashboard displays a series of cards, each representing one of your tracked items. Each card shows you:
- A line chart visualizing the spending trend over the last several months.
- Your total spending for the Last Month.
- Your Average monthly spending for that item.
- Drill Down for Details: Clicking on a card will take you to the Detailed Category Analysis page for that item, allowing you to explore its data further.
Detailed Category Analysis: The Deep Dive
This is where you can perform an in-depth analysis of the entire history of any specific category or category group. You can get to this page either by using the search bar or by clicking on a trend card from the ‘Category Insights’ dashboard.
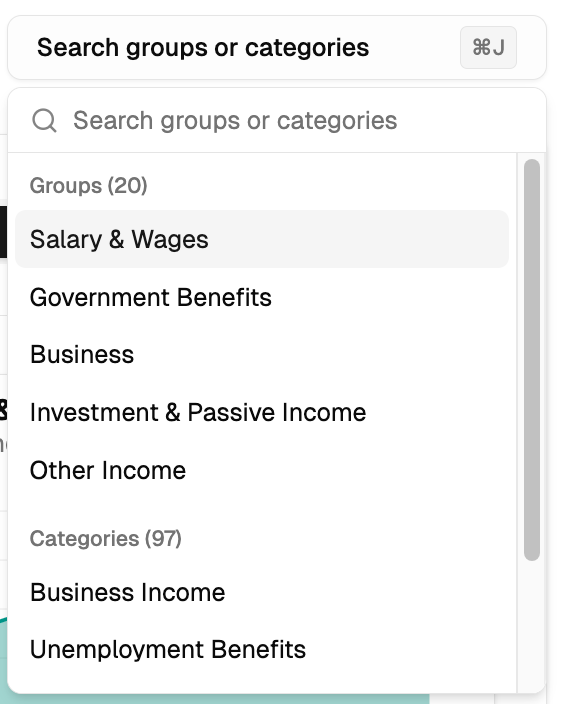
Searching for a Category or Group
At the top of the page, the powerful search bar allows you to instantly find and select any category or group you want to analyze. Simply start typing its name, or use the J keyboard shortcut to open the search box.
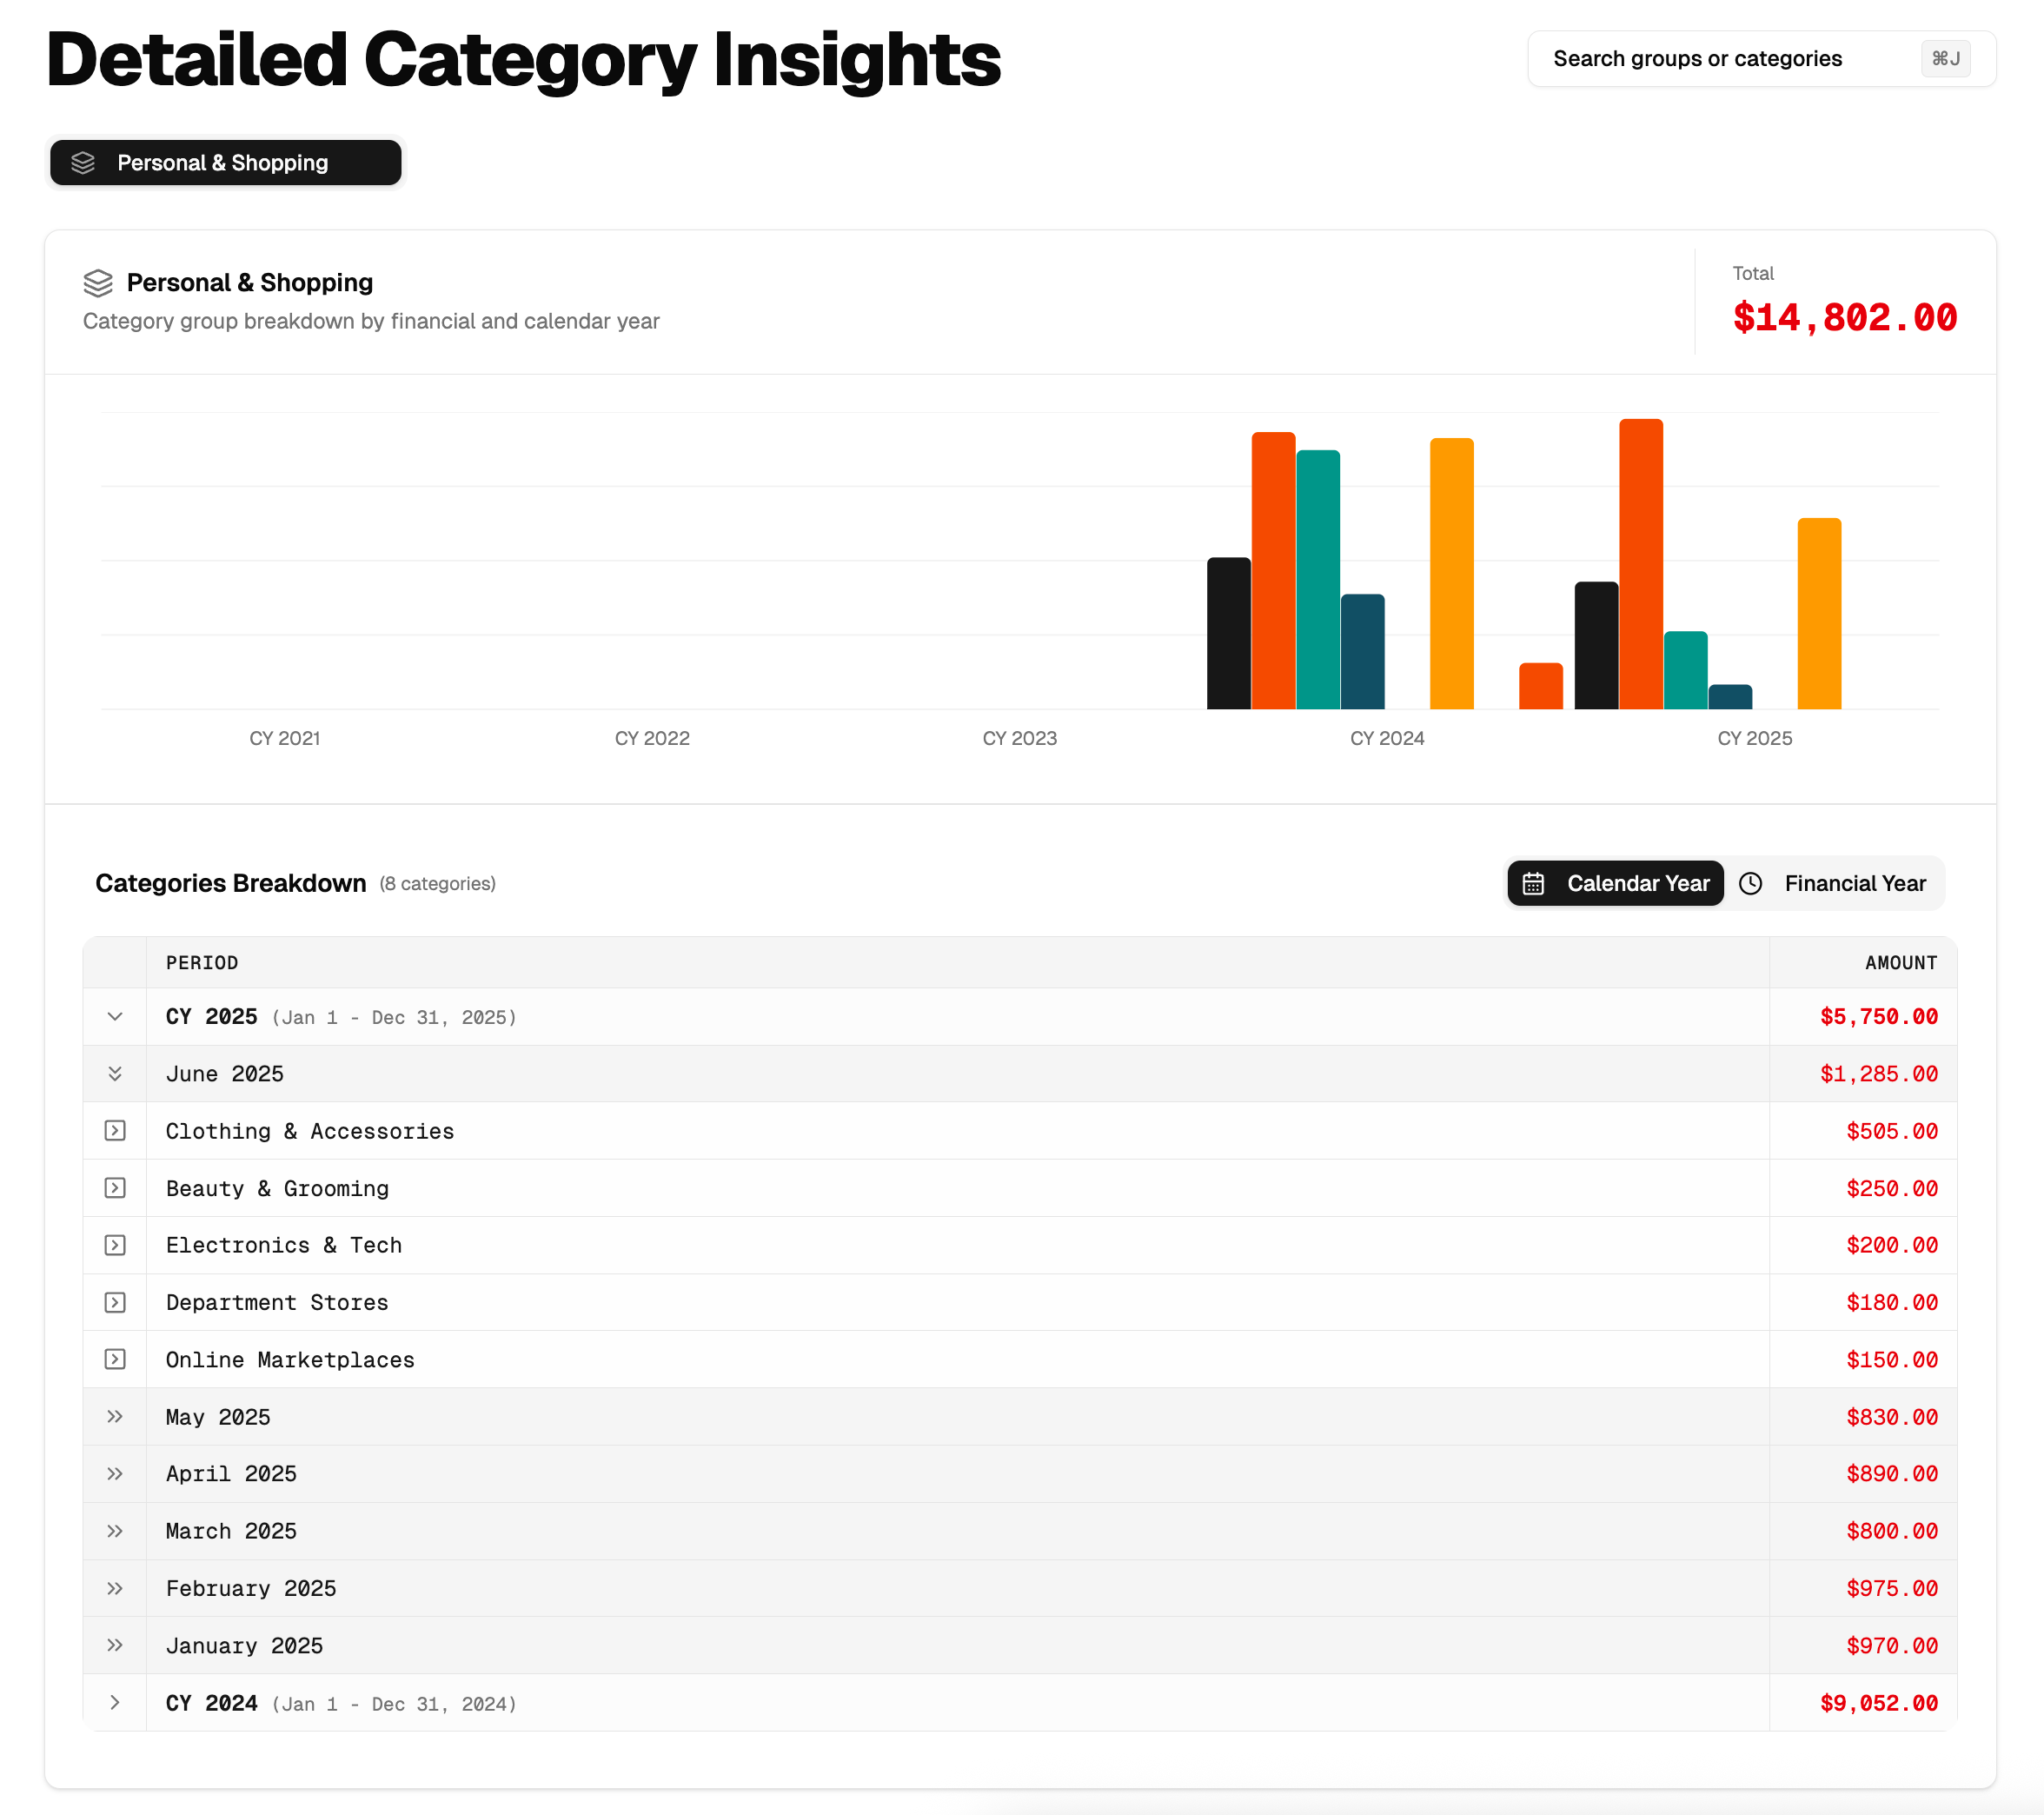
Yearly Trend Chart
Once you’ve selected an item, a bar chart at the top will visualize its total income or expenses for the last several years. This gives you immediate context on its long-term trends. When viewing a category group, this becomes a stacked bar chart, visually showing you how much each category contributed to the group’s total for that year.
The Data Breakdown Table
The main feature of this page is the detailed data table, which breaks down all historical data for the selected item.
- Toggle Year Type: You can switch the entire report between Calendar Year (CY) and Financial Year (FY) to match your personal or tax reporting needs.
- Drill-Down Hierarchy: The table is designed for deep exploration. You can expand any Year to see a summary for each Month. You can then expand any Month to see all the individual Transactions that make up that month’s total.
Comparing with Multiple Tabs
For powerful side-by-side analysis, you can open multiple categories or groups in their own tabs within the page. This is perfect for directly comparing spending in “Groceries” vs. “Restaurants & Dining,” for example.
- You can open as many tabs as you need.
- Switch between them with a simple click.
- Each tab can be reordered or closed individually, giving you full control over your workspace.
Tips for Getting the Most from Category Analysis
- Track What Matters: Actively manage which categories and groups you are tracking to ensure your ‘Category Insights’ dashboard is always relevant to your current financial goals.
- Use Search to Be Quick: Use the J keyboard shortcut and the search bar to quickly jump to any category or group, especially if you have a long list.
- Toggle Between Year Types: Switch between Financial Year (FY) and Calendar Year (CY) views to match your reporting needs, whether for tax purposes or personal review.
- Drill Down to Find the ‘Why’: If a number in a chart looks unusual, use the data table to drill down into the specific months and transactions to understand the story behind the data.
- Compare with Tabs: For a direct comparison, open two or three key categories (like different utility bills or discretionary spending areas) in multiple tabs to analyze them side-by-side.